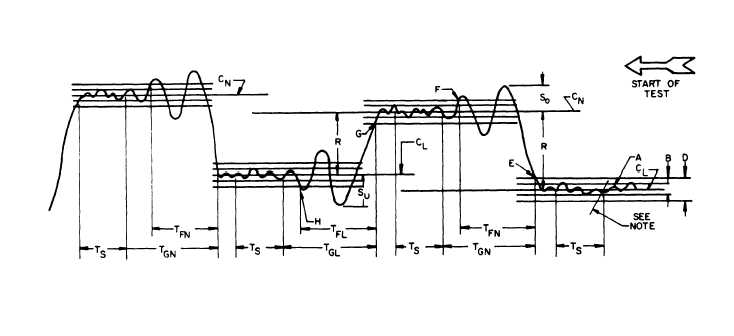
Trace and definitions apply to either voltage or
frequency.
NOTE
Chart marked at start of test.
Actual instrument trace of function.
Observed steady-state band (two lines
parallel to the axis of chart movement,
one each passing through the center points
of maximum and minimum trace excursion
respectively during the short-term stability
sample period, T@,
Mean of observed band.
Mean value at selected load.
Mean value at no load.
Prescribed steady-state band.
Point at which trace initially leaves pre-
scribed load band under condition of
decrease in load.
Point at which trace enters and remains
within prescribed no load band.
Point at which trace initially leaves
prescribed no load band.
Point at which trace enters and remains
within prescribed load band.
Regulation between any two loads.
Surge after a load change.
Overshoot
Undershoot
Observed recovery time, no load to load.
Observed recovery time, load to no load.
Maximum allowable recovery time.
Maximum allowable recovery time, no
load to load.
Maximum allowable recovery time, load
to no load
Prescribed short-term sample time for
determining stability.
ME 6115-545-34/16-1
Figure 16-1.
Overshoot and Undershoot Chart Recording
16-7